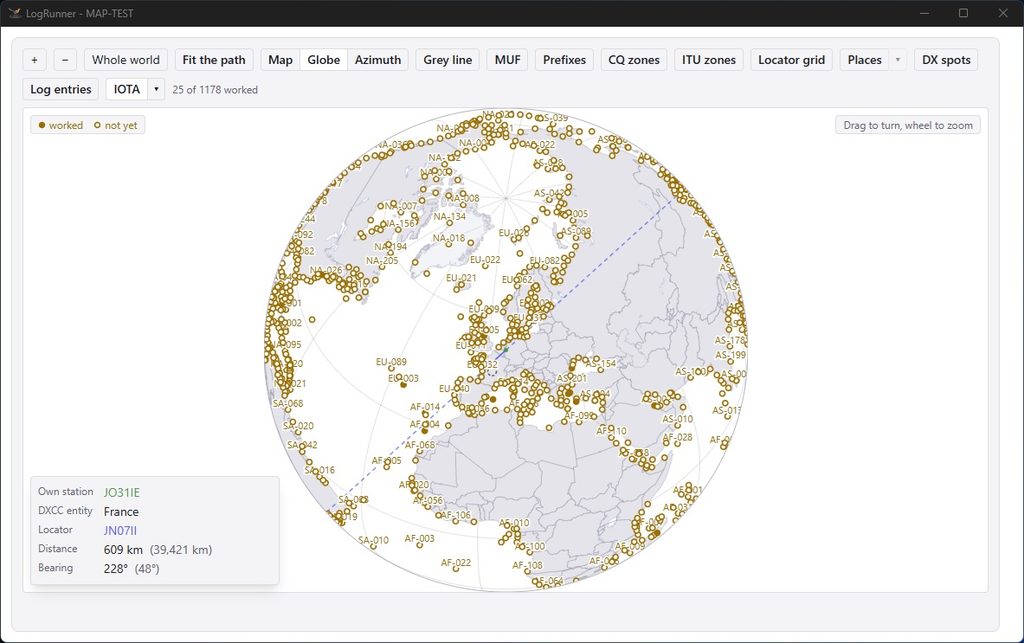
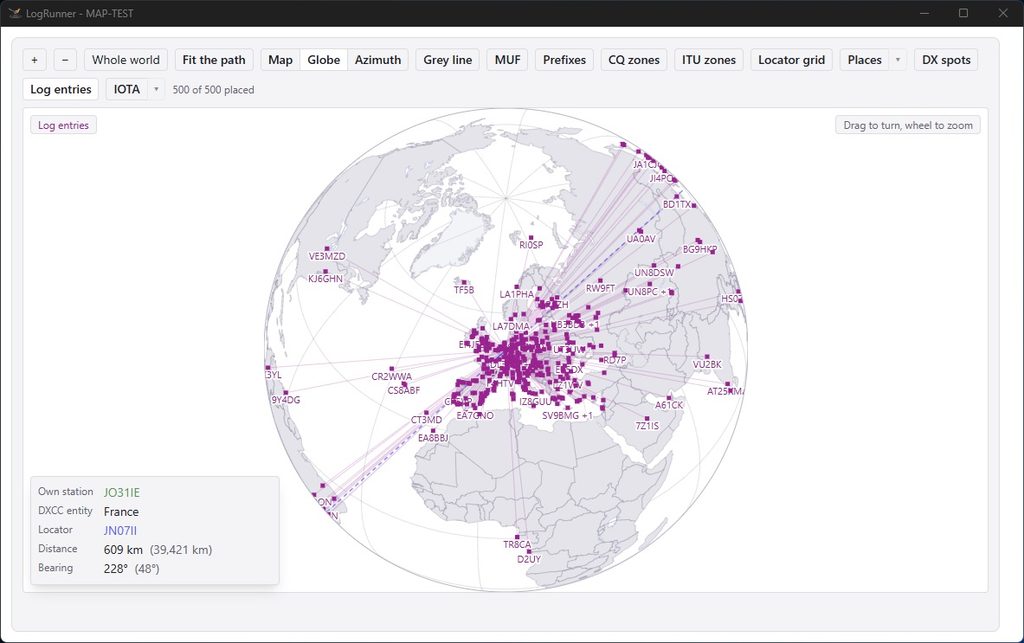
LogRunner features a comprehensive mapping function that generates your data in real time directly from a local database. It works entirely without an internet connection and is therefore ideally suited for offline and field day use.
The key features at a glance:
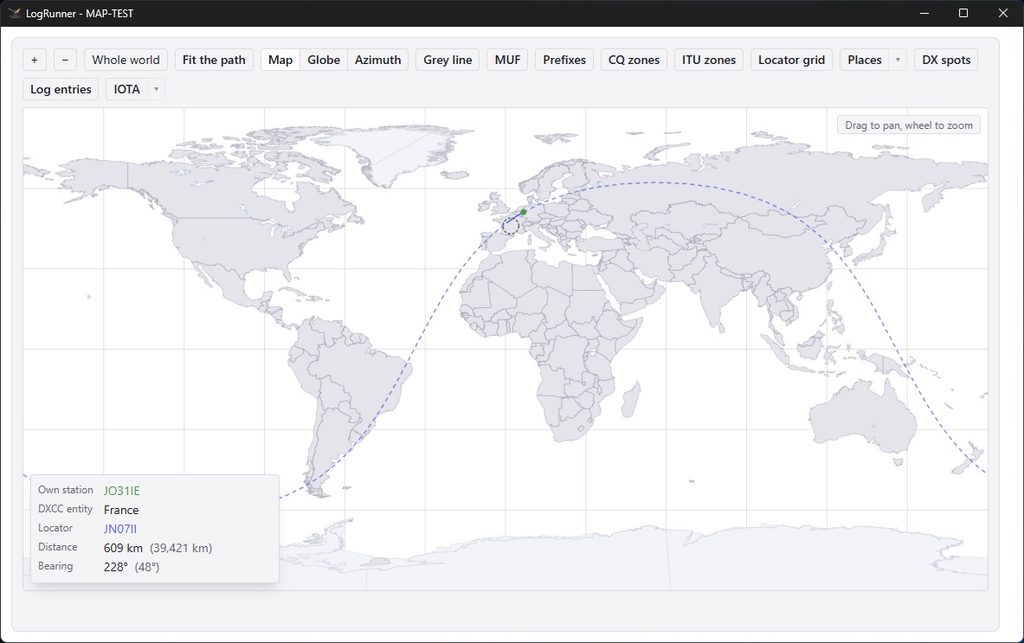
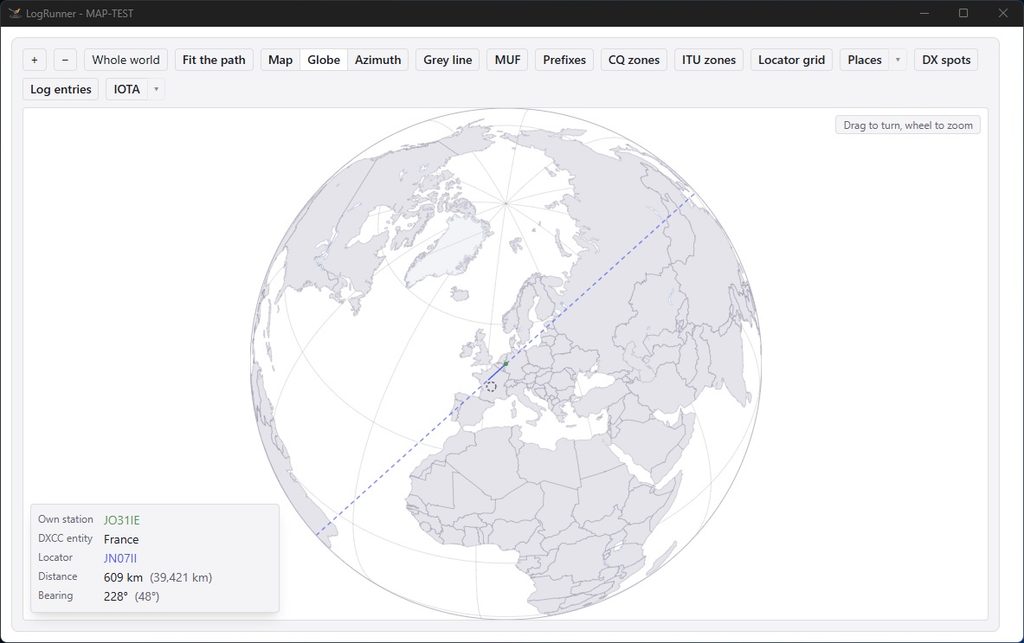
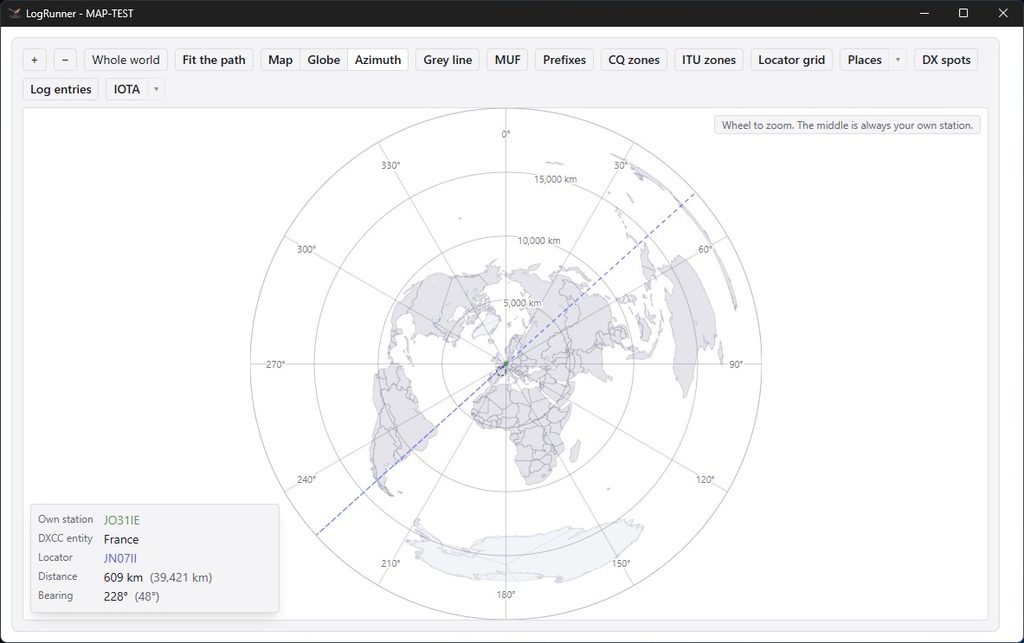
Flexible views: Choose between Mercator, globe or azimuthal projection.
- Interactive DX spots: DX spots are displayed directly on the map. A single click is all it takes for LogRunner to retrieve the frequency and mode and transmit them to the transceiver. The signal path (including the long path) is visualised immediately.
- Propagation conditions & twilight:
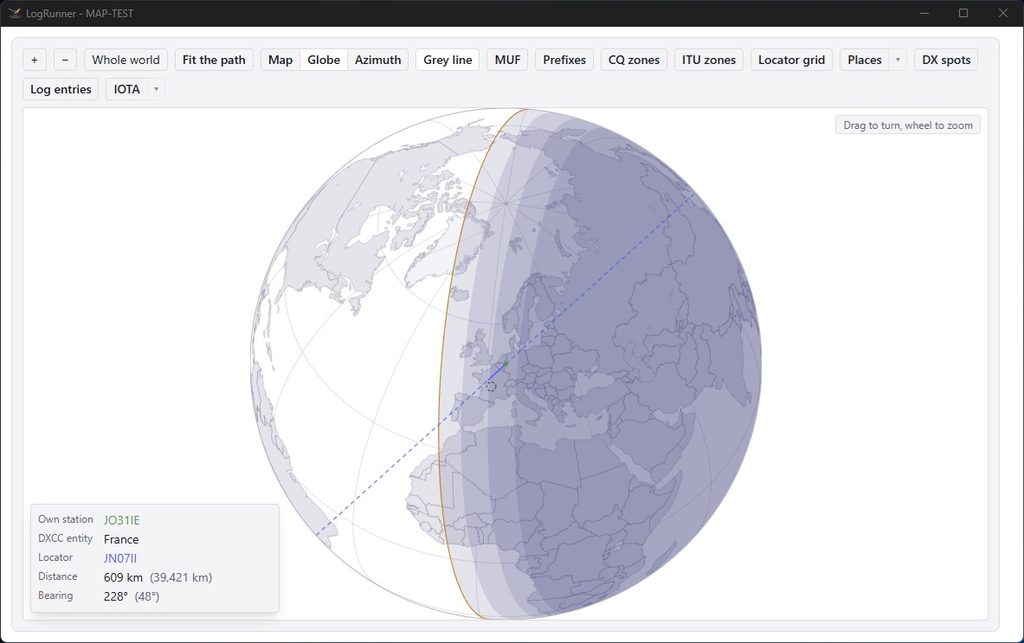
- Grey line (terminator): Day/night display for estimating propagation paths along the twilight zone.
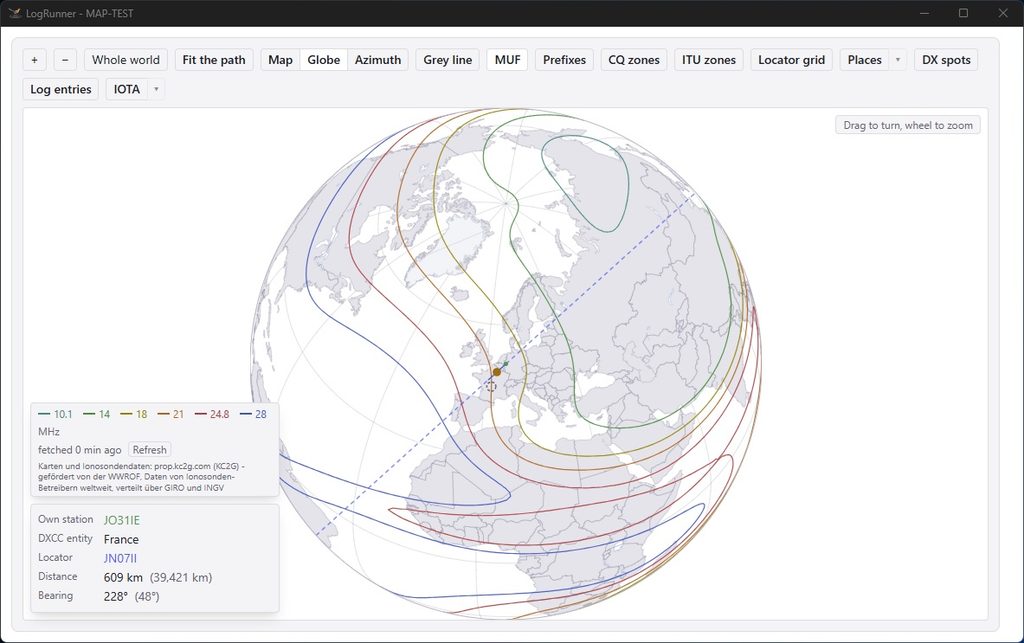
- MUF (Maximum Usable Frequency): Overlaid reflection points and distances in the F2 layer for targeted predictions.
- Logbook & Award Integration:
- QSO Visualisation: Clearly displays logged (or currently filtered) radio contacts on the map.
- IOTA Tracking: Overlays IOTA data and highlights islands that have already been confirmed in colour.
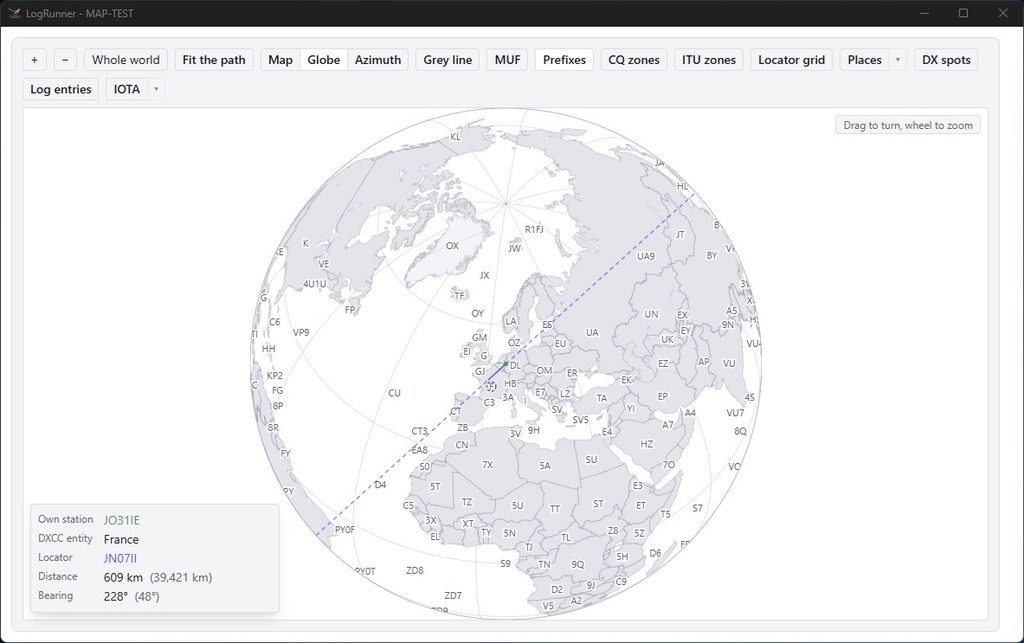
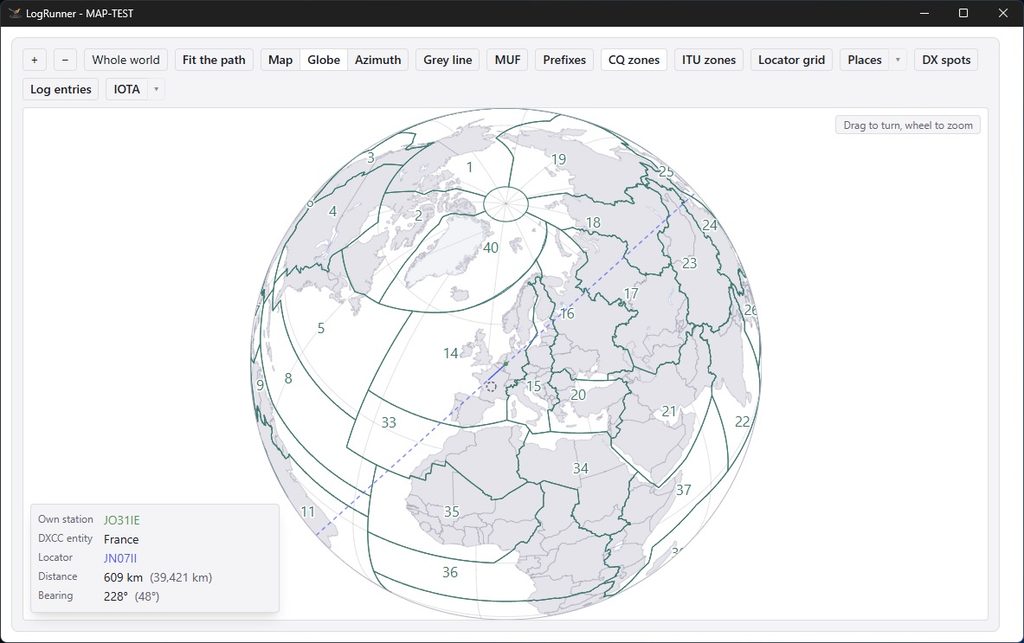
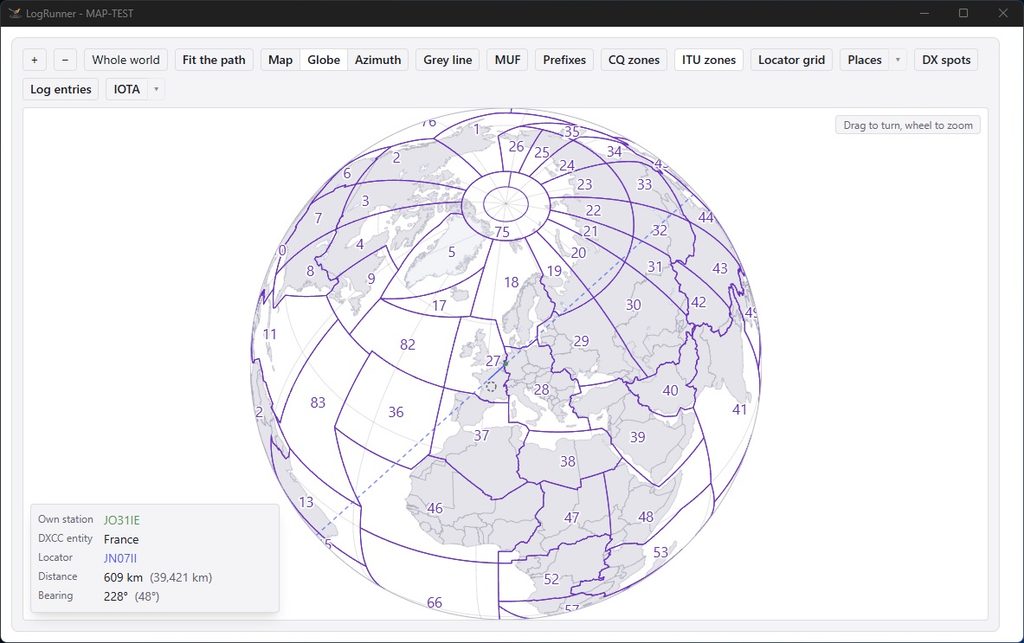
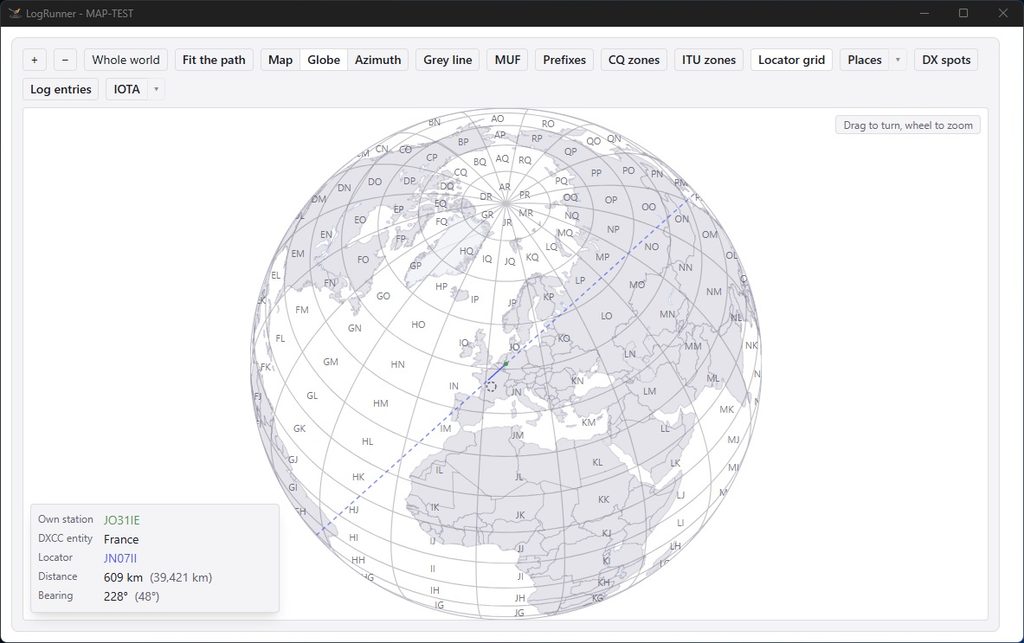
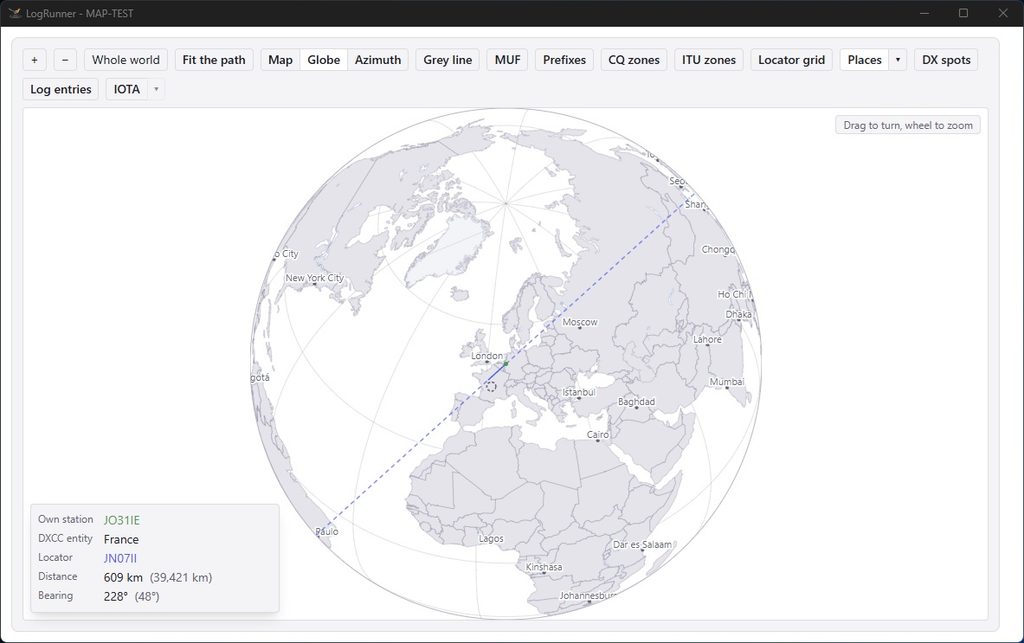
- Extensive overlays: Customisable display of prefixes, CQ zones, ITU zones, Maidenhead locator grids and place names (filterable by population).
Map
Globe
Azimuth
Grey line
MUF
Prefixes
CQ zones
ITU zones
Locator grid
Places
DX spots
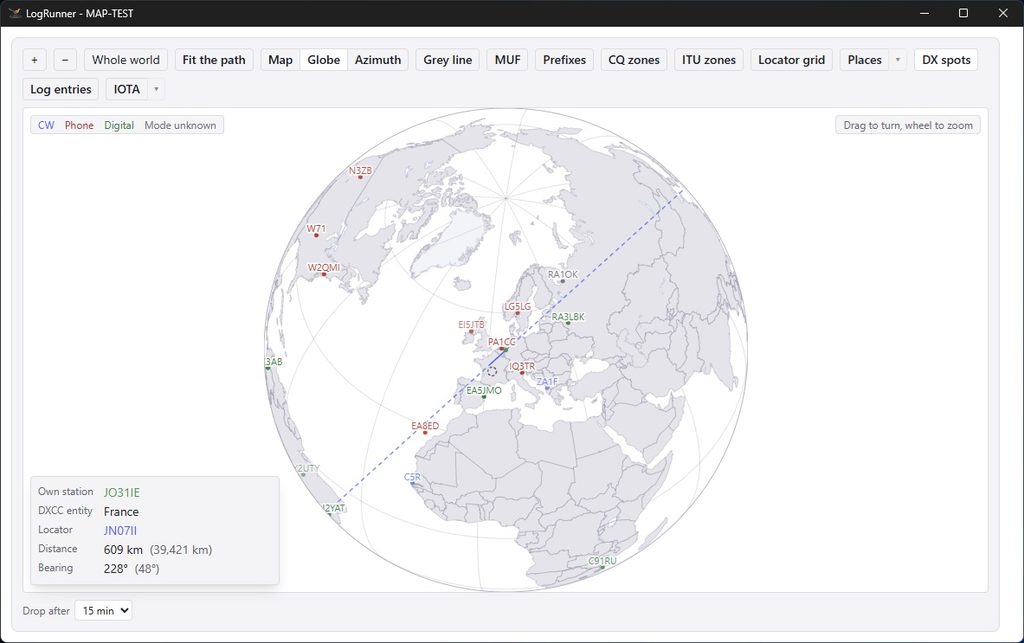
Log entries
IOTA